www.BrandLoyalties.comHome of the BrandLoyalties Metrics | ||
| Home | Basic Concepts White Paper | Big Data Video | BrandLoyalties FAQs | Sample Page |
| Symbol | Equity | Percentile Ranking | Price Correlation | Price Correlation Percentile | Industry | IP Scope | YOY Change Percentile | Revenue Correlation Percentile | Event Risk Percentile |
|---|---|---|---|---|---|---|---|---|---|
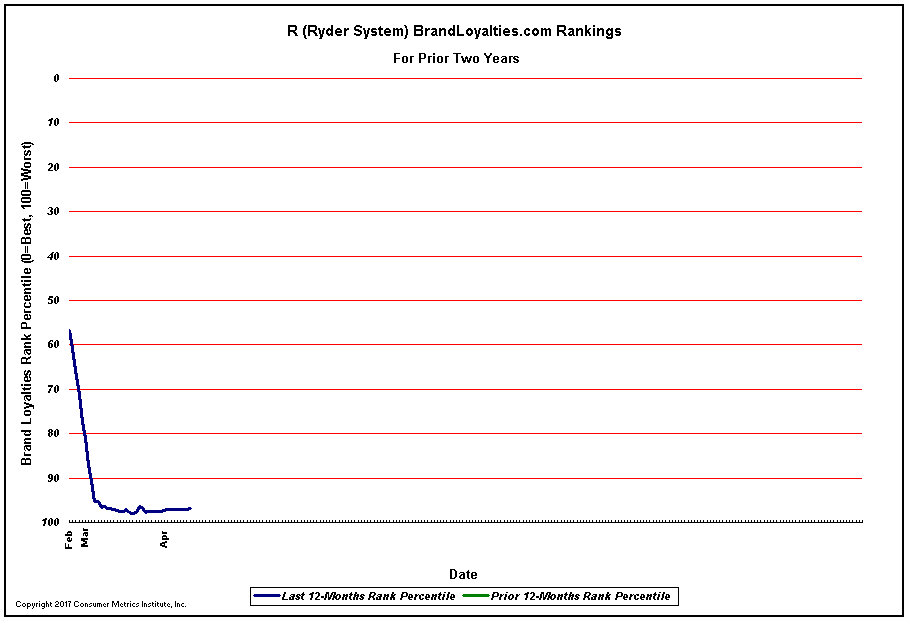
| R | RYDER SYSTEM | 96.9% | -- | -- | Rental/Leasing Companies | US | 50.6% | 42.4% | 66.6% |
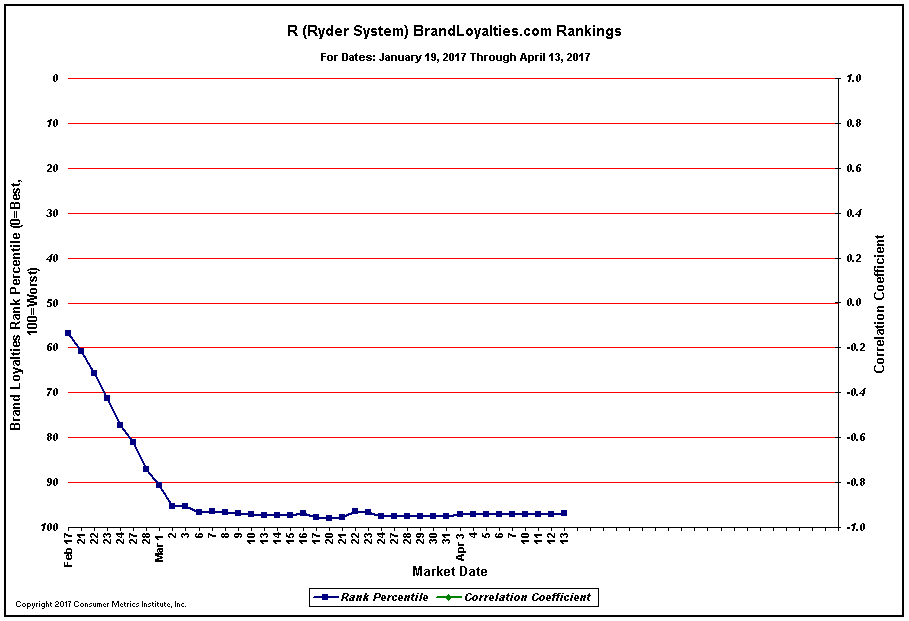
| Date | Ranking Percentile | Correlation Coefficient | Correlation Percentile |
|---|---|---|---|
| 02/17/2017 | 56.8% | -- | -- |
| 02/21/2017 | 60.8% | -- | -- |
| 02/22/2017 | 65.7% | -- | -- |
| 02/23/2017 | 71.2% | -- | -- |
| 02/24/2017 | 77.3% | -- | -- |
| 02/27/2017 | 81.0% | -- | -- |
| 02/28/2017 | 87.0% | -- | -- |
| 03/01/2017 | 90.7% | -- | -- |
| 03/02/2017 | 95.3% | -- | -- |
| 03/03/2017 | 95.4% | -- | -- |
| 03/06/2017 | 96.7% | -- | -- |
| 03/07/2017 | 96.4% | -- | -- |
| 03/08/2017 | 96.8% | -- | -- |
| 03/09/2017 | 96.9% | -- | -- |
| 03/10/2017 | 97.1% | -- | -- |
| 03/13/2017 | 97.3% | -- | -- |
| 03/14/2017 | 97.4% | -- | -- |
| 03/15/2017 | 97.4% | -- | -- |
| 03/16/2017 | 97.0% | -- | -- |
| 03/17/2017 | 97.7% | -- | -- |
| 03/20/2017 | 98.0% | -- | -- |
| 03/21/2017 | 97.7% | -- | -- |
| 03/22/2017 | 96.3% | -- | -- |
| 03/23/2017 | 96.6% | -- | -- |
| 03/24/2017 | 97.7% | -- | -- |
| 03/27/2017 | 97.5% | -- | -- |
| 03/28/2017 | 97.5% | -- | -- |
| 03/29/2017 | 97.6% | -- | -- |
| 03/30/2017 | 97.6% | -- | -- |
| 03/31/2017 | 97.5% | -- | -- |
| 04/03/2017 | 97.2% | -- | -- |
| 04/04/2017 | 97.1% | -- | -- |
| 04/05/2017 | 97.1% | -- | -- |
| 04/06/2017 | 97.1% | -- | -- |
| 04/07/2017 | 97.0% | -- | -- |
| 04/10/2017 | 97.0% | -- | -- |
| 04/11/2017 | 97.1% | -- | -- |
| 04/12/2017 | 97.1% | -- | -- |
| 04/13/2017 | 96.9% | -- | -- |
| Home | Basic Concepts White Paper | Big Data Video | BrandLoyalties FAQs | Sample Page |